
Self-serve analytics tools empower non-technical users by giving them direct access to data, enabling operational directors, sales leaders, and others to assess performance and make informed decisions. Traditional centralized data teams often face bottlenecks due to numerous analytics requests for reports and automation. To address this, modern data teams are adopting a decentralized model, where dispersed analysts work closely with teams to accelerate decision-making without relying solely on the central analytics team.
Lightdash is an excellent example of a self-service analytics tool that empowers users to quickly explore and analyze data. Built directly on top of your dbt project (cloud or core), Lightdash seamlessly integrates with your existing dbt semantic layer. It imports tables, fields, metrics, and metadata, enabling analytics teams to focus on data enablement rather than report generation.
One standout feature of Lightdash is its metric Spotlight, which simplifies data exploration by putting metrics at the forefront. Spotlight allows business users to engage with data in a way that’s intuitive and efficient, avoiding the complexity of working with raw tables or time dimensions.
Exploring Metrics with Spotlight
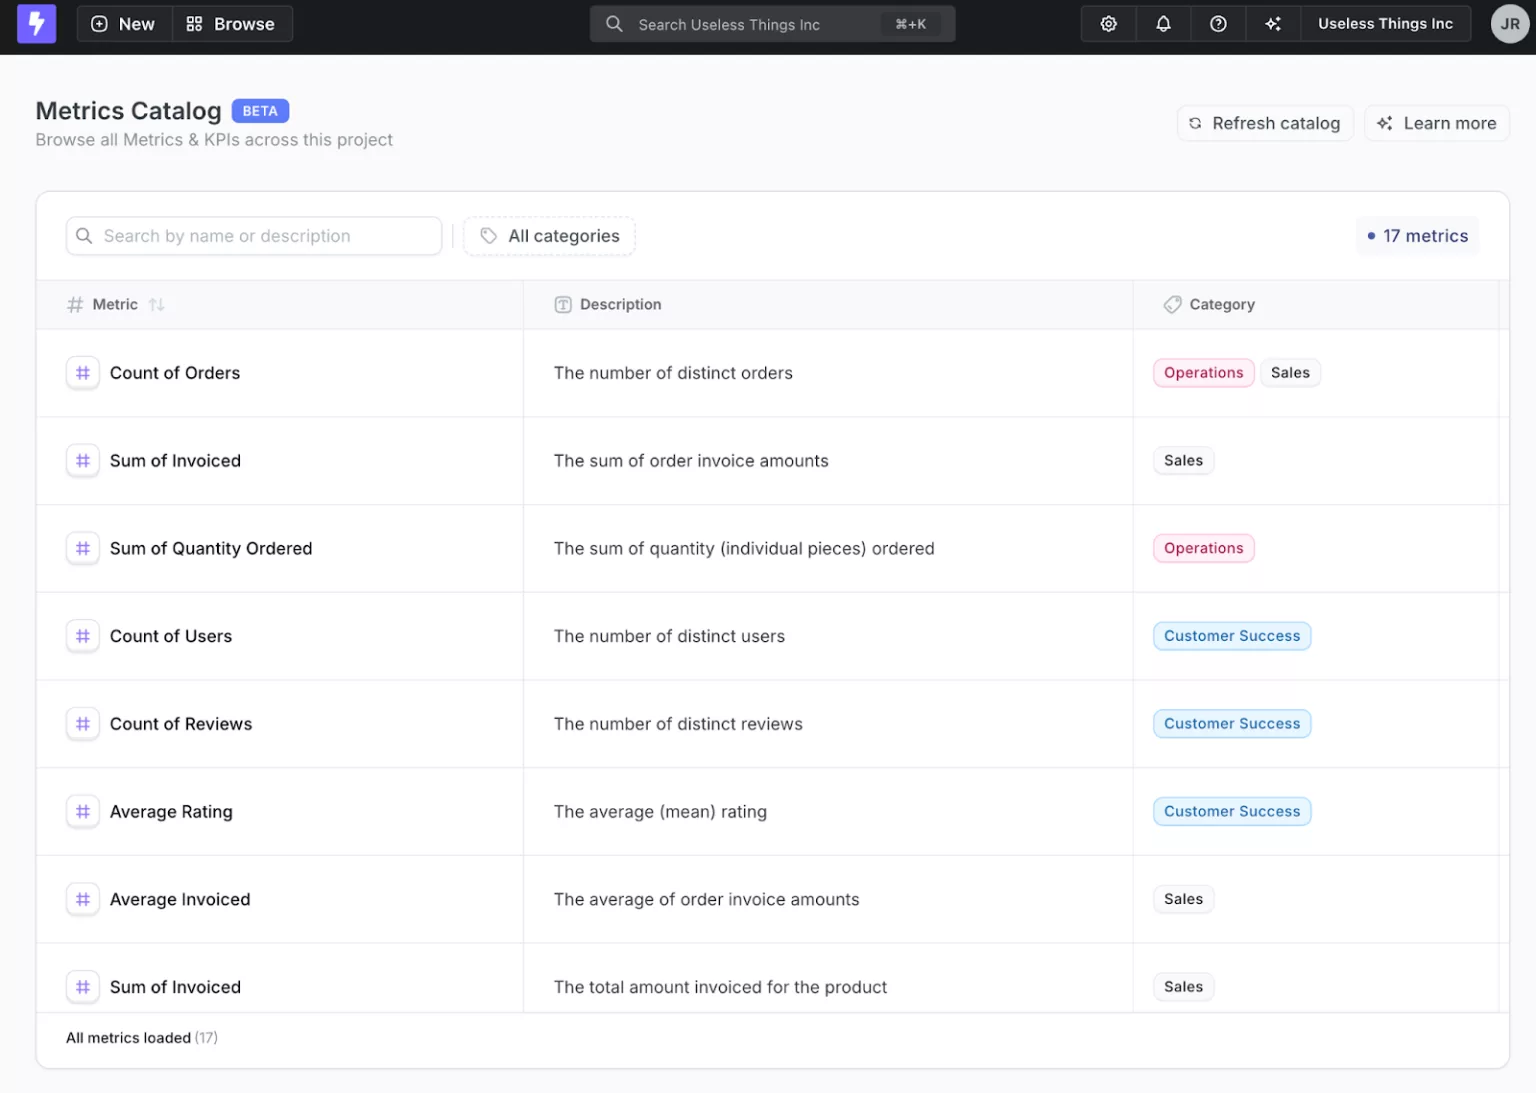
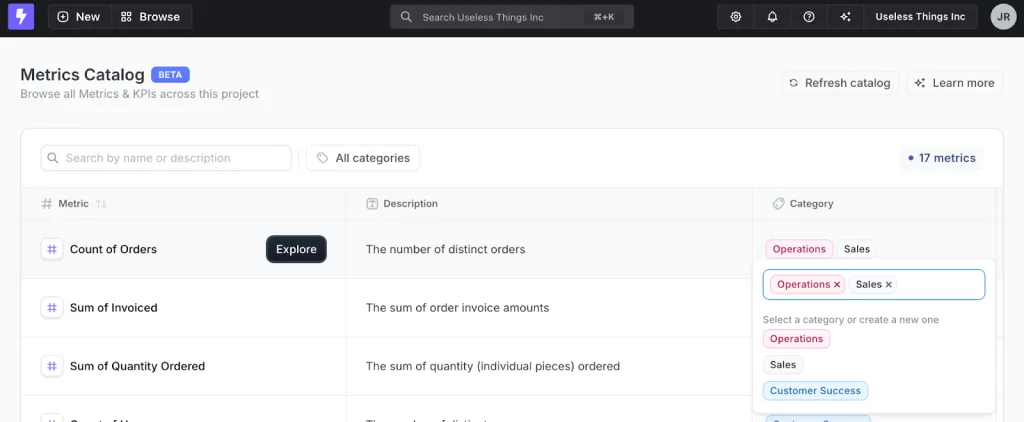
When you access Spotlight, you’re greeted with all the defined metrics from your dbt project. Metadata, such as descriptions, is automatically imported, and categories can be created to align metrics with specific teams or owners. Users can explore any metric by simply hovering over it and clicking the ‘Explore’ button.
Visualizing Metrics
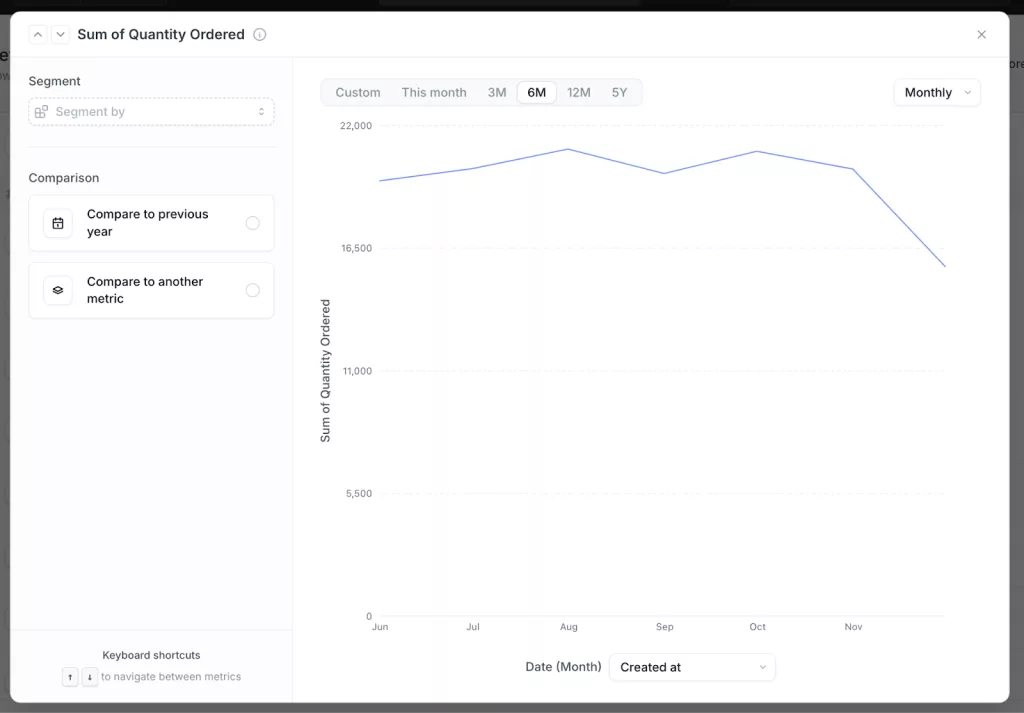
Clicking ‘Explore’ opens a customizable line chart, offering instant insights into daily, weekly, or monthly views of your metric. For more flexibility, the ‘Custom’ option in the time window menu allows you to define your own timeframes. This quick visualization helps users spot trends and patterns without needing to create a full report.
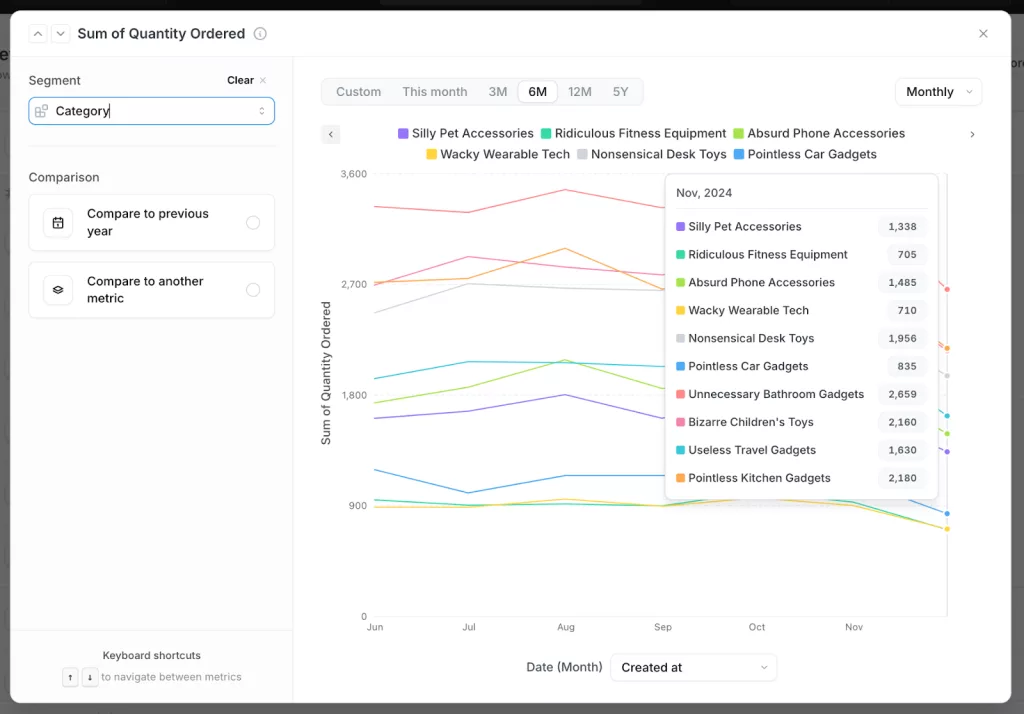
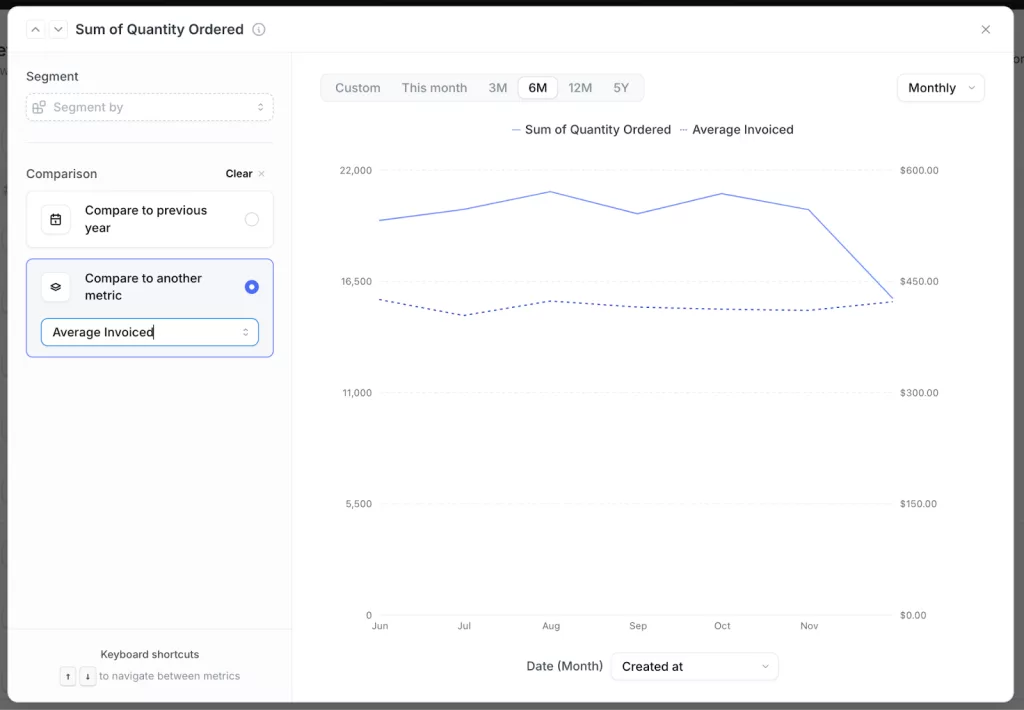
Segmenting and Comparing Data
The left-hand sidebar in Spotlight provides powerful segmentation tools. Users can segment metrics by other dimensions within the table, akin to pivoting data. For example, below we segment the quantity of products ordered by product category to uncover category-specific trends.
Spotlight also facilitates quick comparisons, such as period-over-period analysis or metric-to-metric comparisons. For instance, by bringing in the average invoice amount alongside the quantity ordered, users can assess whether a drop in quantity impacts overall invoiced value.
Empowering End Users to Discover Data
Lightdash’s Spotlight isn’t replacing dashboards, but it does make on-the-fly metric exploration much more intuitive. Instead of running back to the data team every time they need a quick answer, users can dive into the numbers themselves (and, hopefully, learn a thing or two about their data along the way).
Since Lightdash sits directly on top of your dbt project, setup is a breeze—no weird middleware or duplicate metric definitions. Your data team can focus on enablement instead of constantly firefighting report requests.
Lightdash does more than just Spotlight. With Slack & Google Sheets integrations, automated alerts, and a no-code SQL query builder, non-technical users can get even deeper into the data without needing to ping a data engineer every time.
If you don’t want to deal with hosting and maintenance? That’s where we come in.
Get Lightdash Set Up the Right Way with Driftwave
At Driftwave, we know that setting up modern data tools is only half the battle. That’s why we offer managed hosting for Lightdash, with three months free for teams already using dbt. We handle setup, maintenance, and scaling so you can focus on insights, not infrastructure.
Need expert guidance? We also provide consulting services to help you build a modern, scalable data stack that fits your business needs. Whether you’re rolling out self-service analytics or optimizing workflows, we’ve got you covered.